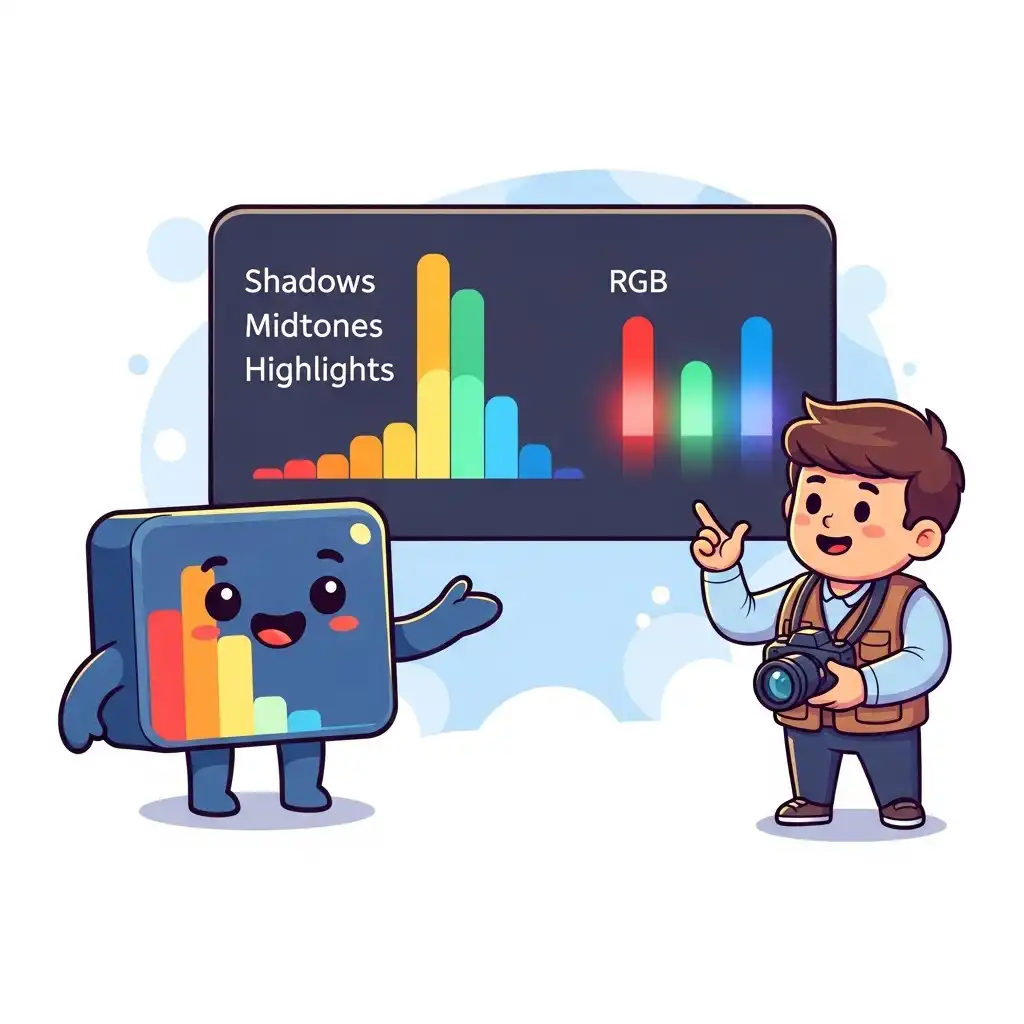
Before you trust your eyes on any edit, understand this: your eyes lie. Room lighting, screen brightness, and visual adaptation all change how the same photograph looks from minute to minute. The histogram is the only witness in your editing room that never lies — a real-time map of your image's light.
Learning how to read a histogram in photo editing is the single fastest upgrade from guessing to knowing: it tells you exactly where your shadows, midtones, and highlights sit, and whether detail is being lost at either extreme. In this complete guide you will learn what a histogram actually shows, how to read it in thirty seconds, how to spot and fix clipping, and how to use a live RGB histogram in our free browser-based editor — no uploads, no signup, no guesswork.
Histogram Photography Explained: What the Graph Actually Shows
A histogram is a graphical representation of your image's luminance. The horizontal axis charts brightness from pure black on the far left to pure white on the far right; the vertical axis shows how many pixels sit at each brightness level. A tall peak means many pixels share that tone; a flat region means few. An RGB histogram goes one step further and draws three overlapping curves — red, green, and blue — so you can see not only overall exposure but color intensity per channel.
Nothing about the graph is a judgment: it does not say your photo is good or bad. It simply reports, with perfect honesty, where your pixels live between black and white.
How to Read a Histogram in Photo Editing: Left, Center, Right
Reading the curve takes thirty seconds once you know the three zones. Left edge — shadows: pixels close to pure black; blocked-up shadows mean lost detail in dark areas. Center — midtones: the heart of most photographs, where skin, foliage, walls, and sky usually live. Right edge — highlights: pixels close to pure white; this is where specular reflections and bright skies sit.
A balanced, well-exposed image typically shows a curve that spans the whole range without slamming into either wall. But there is no "perfect" shape: a snowy landscape legitimately piles to the right, a night skyline to the left. The histogram tells you what is true, not what is pretty.
Clipping: How to Spot Lost Shadows and Blown Highlights
Clipping is the histogram's most important warning. When the curve touches or piles hard against the left wall, shadow detail is crushed to pure black; when it touches the right wall, highlight detail is blown to pure white. Some clipping can be intentional — a silhouette is nothing but deliberate clipping — but it must be a decision, never an accident.
To fix accidental clipping, start with exposure: pull it down to recover highlights or up to open shadows, then use highlight and shadow recovery sliders to rebalance. Check the edges of the curve after every major adjustment; the histogram updates live, so you always know exactly how much detail remains.
How to Use a Histogram in Photo Editing: Step by Step
- Open your photo with the histogram visible: our rgb histogram photo editor online displays the live curve while you work, entirely in your browser.
- Before touching a single slider, read the edges: note whether shadows or highlights are already clipped in the original.
- Make your first exposure adjustment, then re-read the curve: did the pile move away from the wall, or into it?
- Balance the tonal ranges intentionally: recovering shadow detail often costs some highlight headroom, so protect what matters most for your subject.
- Re-check the histogram after color grading: because saturation and contrast shifts move the curve too.
- Finish with a 100% zoom inspection: and a before/after comparison, so the numbers and your eyes finally agree.
Why Your Screen Lies (and the Histogram Doesn't)
Your perception adapts within minutes: a bright room makes the display feel dark and pushes you to over-brighten; a dark room does the opposite. An uncalibrated monitor adds its own color and brightness distortion on top. The histogram is immune to all of it — the same image produces the same curve on every machine on Earth.
That is why professionals glance at the graph after every major adjustment instead of trusting their adapted eyes, and why the histogram is the fastest defense against gradual over-editing during long sessions.
Common Histogram Mistakes (and How to Avoid Them)
- Chasing a "perfect" mountain: a centered bell curve is not a goal, and many great photographs are deliberately high-key or low-key.
- Ignoring the RGB channels: a sunset can clip the red channel while the luminance curve looks fine, producing posterized skies and unnatural skin — check the three color curves, not just the combined one.
- Judging on a bad display: making exposure decisions on an uncalibrated, over-bright screen compounds error.
- Reading once and never again: the histogram must be consulted after each stage, because contrast, curves, and grading all move your pixels.
When to Ignore the Histogram on Purpose
The histogram describes; it does not dictate. High-key portraits, silhouettes, foggy minimalism, and night scenes all produce "extreme" histograms that are exactly right for their purpose. Once you can read the curve fluently, you earn the right to ignore it deliberately — clipping a background to pure white for a clean product shot is a choice, not a mistake. That fluency is the difference between editing by rules and editing by intention: the graph informs your decision, then your intention makes the final call.
Frequently Asked Questions
What does a good histogram look like?
How do I stop clipping shadows and highlights?
Is an RGB histogram different from a luminance histogram?
Can I see a live histogram in a free online photo editor?
Does the histogram tell me my photo is overexposed?
The Takeaway
The histogram is the cheapest skill upgrade in photography: five minutes to learn, a lifetime of consistent exposure decisions. Read the edges before you edit, re-read them after every major change, and let intention — not fear — decide what gets clipped. Practice it live in our editor, where your files never leave your browser.
Key Takeaways:
- The histogram maps brightness from black to white.
- Piling at the walls means clipping.
- There is no perfect shape, only intentional ones.
- Check the RGB channels, not just luminance.
- Consult the graph after every stage, and break its rules only on purpose.